How to Accurately Measure VRAM Usage
This article provides a practical guide on how to accurately measure VRAM usage in Python for NVIDIA GPU. It starts by explaining why monitoring VRAM is important, then introduces a profiler that can track the VRAM usage of a process throughout its execution. Finally, a real world example is presented to illustrate the usage of such a profiler.
Why Measure VRAM Usage?
In many fields, such as AI or high-performance computing, VRAM usage is a critical factor. Profiling VRAM usage is especially important for AI models running on devices, where memory constraints are often stricter. Sometimes, it may even be the main limitation. Profiling the VRAM usage of a process allows developers to anticipate and solve problems before they occur. Typical benefits of VRAM profiling include:
- Identifying memory peaks and bottlenecks;
- Improving performance, cost-efficiency, or scalability;
- Adapting to specific hardware constraints, especially for on-device AI models;
- Diagnosing layers that could benefit from dedicated GPU optimization (such as custom kernels or layer fusion).
How to Measure Memory Usage in Python?
pip install nvidia-ml-py
VRAM Profiling
To track GPU memory (VRAM) usage on a system with an NVIDIA GPU, the library pynvml is recommanded. The best way to install it is through pip with the following command:
The library nvidia-ml-py is still maintained by Nvidia unlike nvidia-ml-py3 which is no longer maintained.
You can use this library to check if a GPU is available:
from pynvml import *

@lru_cache()
def is_gpu_available() -> bool:
    try:
        nvmlInit()
        nvmlShutdown()
        return True
    except Exception:
        return False
Here is an example to retrieve the VRAM usage of a process using pynvml:
from pynvml import *

def initialize_nvml():
    """Initialize NVML and return the handle to the first GPU."""
    try:
        nvmlInit()
        assert nvmlDeviceGetCount() == 1  # Assumes a single GPU
        return nvmlDeviceGetHandleByIndex(0)
    except Exception as e:
        print(f"Failed to initialize NVML: {e}")
        return None

def close_nvml():
    """Shutdown NVML."""
    try:
        nvmlShutdown()
    except Exception as e:
        print(f"Failed to close NVML: {e}")

def get_pid_vram_used_bytes(pid, handle):
    """Return the VRAM usage in bytes for a given process."""
    for p in nvmlDeviceGetComputeRunningProcesses(handle):
        if p.pid == pid:
            return p.usedGpuMemory
    return 0
Making the Output Human-Readable
The profiler returns raw byte values. To make these easier to read, you can convert them into human-readable units like MB or GB using the following function:
def bytes2human(number: int, decimal_unit: bool = True) -> str:
    symbols = ['K', 'M', 'G', 'T', 'P', 'E', 'Z', 'Y']
    symbol_values = [(symbol, 1000**(i+1) if decimal_unit else (1 << (i+1) * 10))
                     for i, symbol in enumerate(symbols)]

    for symbol, value in reversed(symbol_values):
        if number >= value:
            suffix = "B" if decimal_unit else "iB"
            return f"{float(number)/value:.2f}{symbol}{suffix}"

    return f"{number} B"
VRAM Profiler
This profiler class acts as a context manager that continuously monitors VRAM usage of a target process and optionally saves the results to a CSV file.
from multiprocessing import Process, Queue, Event
import os
import time

class SkProfiler:
    """
    Context manager to monitor VRAM usage during a code block.

    Usage:
        with SkProfiler(name):
            # your code here

    Args:
        name (str): Name of the memory scope.
        result_file (str, optional): Path to the file where results will be saved.
        pid (int, optional): Process ID to monitor. Defaults to current process.
        time_interval (float, optional): Sampling interval in seconds.
    """

    def __init__(self, name: str, result_file : str = None, pid : int = None, time_interval: float = 0.05):
        self._name = name
        self._vram_queue = Queue(maxsize=100000)

        self._stop_event = Event()
        self._monitor_process: Optional[Process] = None
        self._result_file = result_file
        self._time_interval = time_interval

        self._pid = pid

    def __enter__(self):
        """Start the memory profiler process."""
        pid = self._pid if self._pid else os.getpid()
        self._monitor_process = Process(target=_memory_profiler,
                                        args=(pid,
                                              self._stop_event,
                                              self._vram_queue,
                                              self._time_interval))
        self._monitor_process.start()

    def __exit__(self, exception_type, exception_value, exception_traceback):
        """Stop the memory monitor process and write results to file if specified."""
        self._stop_event.set()  # Signal the monitor process to stop
        assert self._monitor_process is not None

        if self._monitor_process.is_alive():
            self._monitor_process.join(timeout=15) # Wait for the process to finish
            # If it is still alive after 15 seconds, kill it
            if self._monitor_process.is_alive():
                self._monitor_process.terminate()
                print("Warning: monitor process did not exit cleanly.")

        # Write the results to the result file
        if self._result_file:
            with open(self._result_file, "w") as f:
                # Write header
                f.write("Time, VRAM_usage\n")
                index = 0
                while not self._vram_queue.empty()
                    vram_use = self._vram_queue.get()
                    # Time is approximated
                    f.write(f"{round(index*self._time_interval, 2)}, {bytes2human(vram_use, False)}\n")
                    index += 1
While the target process is running, a dedicated background process samples VRAM usage at regular intervals and records the values.
def _memory_profiler(pid: int, stop_event: EventClass,
                    ram_queue, vram_queue, time_interval) -> None:
    """
    Monitor RAM and VRAM usage of a process in a separate process.

    Args:
        pid (int): Process ID to monitor.
        stop_event (Event): Event to signal when to stop monitoring.
        vram_queue (Queue): Queue to store VRAM usage values.
        time_interval (float): Sampling interval in seconds.
    """
    if not is_gpu_available():
        print("No GPU available. Skipping VRAM monitoring.")
        return
    print(f"Measuring VRAM usage of process {pid} started.")

    handle = initialize_nvml()

    # Monitor while the process is running
    while not stop_event.is_set():
        if vram_queue:
            # Add the VRAM usage of the process to the queue
            vram_queue.put(get_pid_vram_used_bytes(pid, handle))
        time.sleep(time_interval)  # Arbitrary time interval (in s)
    close_nvml()
Example : VRAM measurements for YOLOv8n vs ViT Base Patch16 224
Suppose you want to benchmark the performance of the yolov8n and vit_base_patch16_224 models. For both, we use the same backend: ONNX C with CUDA. We assume a compiled benchmarking tool (benchmark_exec) takes the model name as an argument.
def run_benchmark(model):
    """Run the benchmark on a model."""
    csv_file_name = model+"_result.csv"

    proc = subprocess.Popen(
        ["src/benchmark_exec", model],
        stdout=subprocess.PIPE,
        stderr=subprocess.PIPE,
        text=True
    )
    with SkProfiler(name, csv_file_name, pid=proc.pid):
        proc.wait()
    err = proc.stderr.read()
    if err:
        print(f"Error: {err}")
    else:
        print(f"Benchmark completed successfully for model {model}.")
The results are saved in a CSV file named {model_name}_result.csv. The CSV file contains the following columns:
-
Time: The time in seconds since the start of the benchmark. -
VRAM_usage: The amount of VRAM used by the process.
The CSV file can be visualized using a library like matplotlib. The following code reads the file and generates a plot of the VRAM usage over time.
import pandas as pd
import matplotlib.pyplot as plt

# Read the CSV file
df = pd.read_csv("result.csv")

# Plot VRAM usage
plt.figure(figsize=(12, 6))
plt.plot(df["Time"], df[" VRAM_usage"], label="VRAM Usage", color="orange")
plt.xlabel("Time (s)")
plt.ylabel("Memory Usage (MB)")
plt.title("VRAM Usage Over Time")
plt.legend()
plt.grid()
plt.savefig("vram_yolov8n.png")
plt.show()
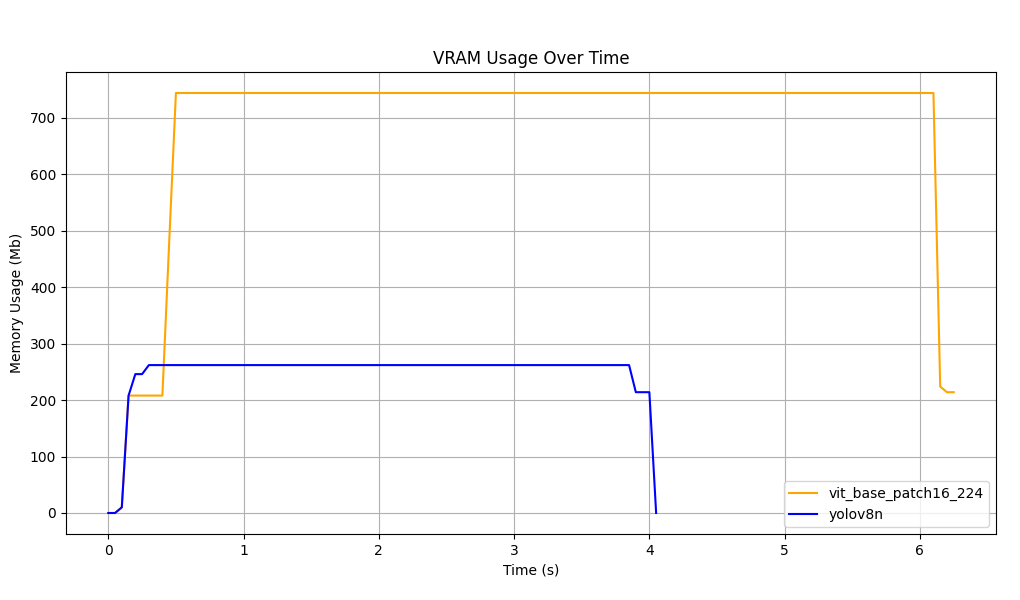
As shown in the plot, the VRAM usage of the two processes is very different. The yolov8n model uses less VRAM than the vit model. It is also important to note that, the execution time of the vit is also higher.
Depending on your needs, you can choose the backend and model that best fit your hardware constraints. If you need a model with a low memory footprint, yolov8n is good choice.
Conclusion
Profiling helps you select the right model and backend for your constraints. As on-device inference grows, protecting the model from theft becomes a new challenge. Skyld helps you by securing your models both at rest and during execution, using mathematical transformations to keep model weights confidential.
References
This profiler is inspired by this article by Thomas Rouch.